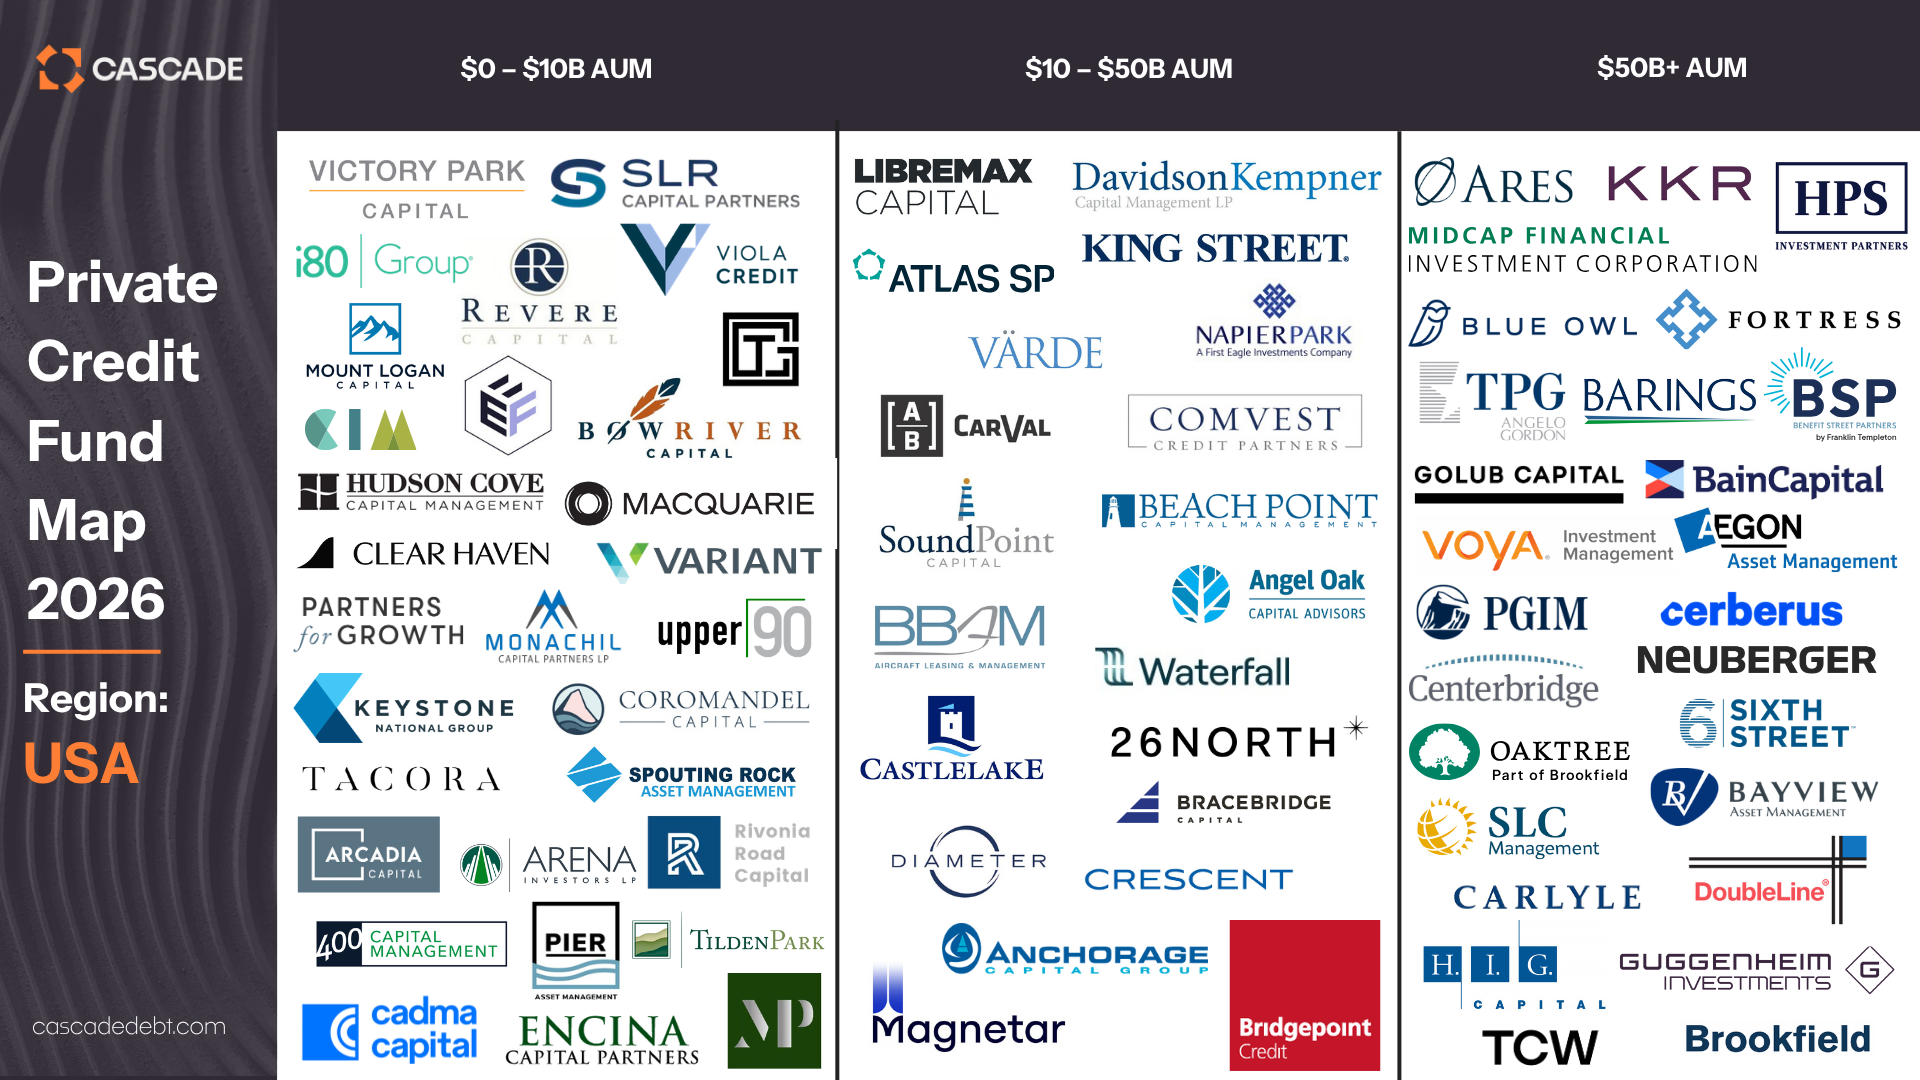
Last year we published our first US Debt Investor Market Map to help borrowers and sponsors navigate a crowded and fast-growing lender universe. Twelve months on, the market has gotten louder. More capital has flooded into private credit, more generalist funds now claim ABL expertise, and it's harder than ever to tell who's actually active in asset-based lending from who's just listing it on a website.
For 2026 we rebuilt the map from the ground up and renamed it the Private Credit Fund Map. The new name reflects a tighter focus: every firm on it has been screened for real, evidenced activity in asset-backed and structured credit lending, not just private credit broadly. The result is a leaner, more useful universe of active private credit funds, organized to spotlight the smaller, more specialized managers that often make the best partners on complex deals.
Notable Trends in the US Market
The smaller end of the market is where the action is. The $0–10B tier is the largest of the three, and it's not close — these firms tend to be nimbler underwriters, more willing to structure around a borrower's specific situation, and often faster to a term sheet than their larger peers. If you're a sponsor or borrower with a complex or non-standard asset-backed story, this is increasingly the group worth calling first.
Scale still matters at the top, but the middle has thinned. The $50B+ tier remains large and well represented — these are the platforms with the balance sheet to anchor bigger, more standardized facilities. The $10–50B mid-tier is the smallest group on the map this year, which tracks with what we're seeing in the market: capital is consolidating at the largest platforms while specialist managers proliferate below them, leaving fewer firms in between.
Real ABL activity is more concentrated than headcount suggests. A large share of firms that describe themselves as "private credit" do not, on closer inspection, have documented asset-based lending activity. Screening for evidence rather than self-description cut our list meaningfully from the raw universe of SF Vegas attendees — a reminder to borrowers and sponsors to look past a firm's marketing language to what it has actually closed.
Want the Full Breakdown?
The map above is just a snapshot. We’ve also built a deeper dive by region and strategy, including active investors in Europe, LATAM, Africa, and Asia – additionalupdates to these maps will be released in the coming week.
Think your firm should be included? Or looking to get introduced to any of the investors listed?Reach out— we’d be happy to connect.
Want to learn more about how Cascade Debt helps connect businesses to debt financing sources, structure, and manage loans? Schedule a demo with our team.
Mapping Private Credit Funds in the United States 2026
The US private credit market continues to grow in depth and complexity—fueled by demand from both asset originators seeking flexible capital and investors
Last year we published our first US Debt Investor Market Map to help borrowers and sponsors navigate a crowded and fast-growing lender universe. Twelve months on, the market has gotten louder. More capital has flooded into private credit, more generalist funds now claim ABL expertise, and it's harder than ever to tell who's actually active in asset-based lending from who's just listing it on a website.
For 2026 we rebuilt the map from the ground up and renamed it the Private Credit Fund Map. The new name reflects a tighter focus: every firm on it has been screened for real, evidenced activity in asset-backed and structured credit lending, not just private credit broadly. The result is a leaner, more useful universe of active private credit funds, organized to spotlight the smaller, more specialized managers that often make the best partners on complex deals.
Notable Trends in the US Market
The smaller end of the market is where the action is. The $0–10B tier is the largest of the three, and it's not close — these firms tend to be nimbler underwriters, more willing to structure around a borrower's specific situation, and often faster to a term sheet than their larger peers. If you're a sponsor or borrower with a complex or non-standard asset-backed story, this is increasingly the group worth calling first.
Scale still matters at the top, but the middle has thinned. The $50B+ tier remains large and well represented — these are the platforms with the balance sheet to anchor bigger, more standardized facilities. The $10–50B mid-tier is the smallest group on the map this year, which tracks with what we're seeing in the market: capital is consolidating at the largest platforms while specialist managers proliferate below them, leaving fewer firms in between.
Real ABL activity is more concentrated than headcount suggests. A large share of firms that describe themselves as "private credit" do not, on closer inspection, have documented asset-based lending activity. Screening for evidence rather than self-description cut our list meaningfully from the raw universe of SF Vegas attendees — a reminder to borrowers and sponsors to look past a firm's marketing language to what it has actually closed.
Want the Full Breakdown?
The map above is just a snapshot. We’ve also built a deeper dive by region and strategy, including active investors in Europe, LATAM, Africa, and Asia – additionalupdates to these maps will be released in the coming week.
Think your firm should be included? Or looking to get introduced to any of the investors listed?Reach out— we’d be happy to connect.
Want to learn more about how Cascade Debt helps connect businesses to debt financing sources, structure, and manage loans? Schedule a demo with our team.
Stay Connected
No spam. Just the latest releases and tips, interesting articles, and exclusive interviews in your inbox every week.